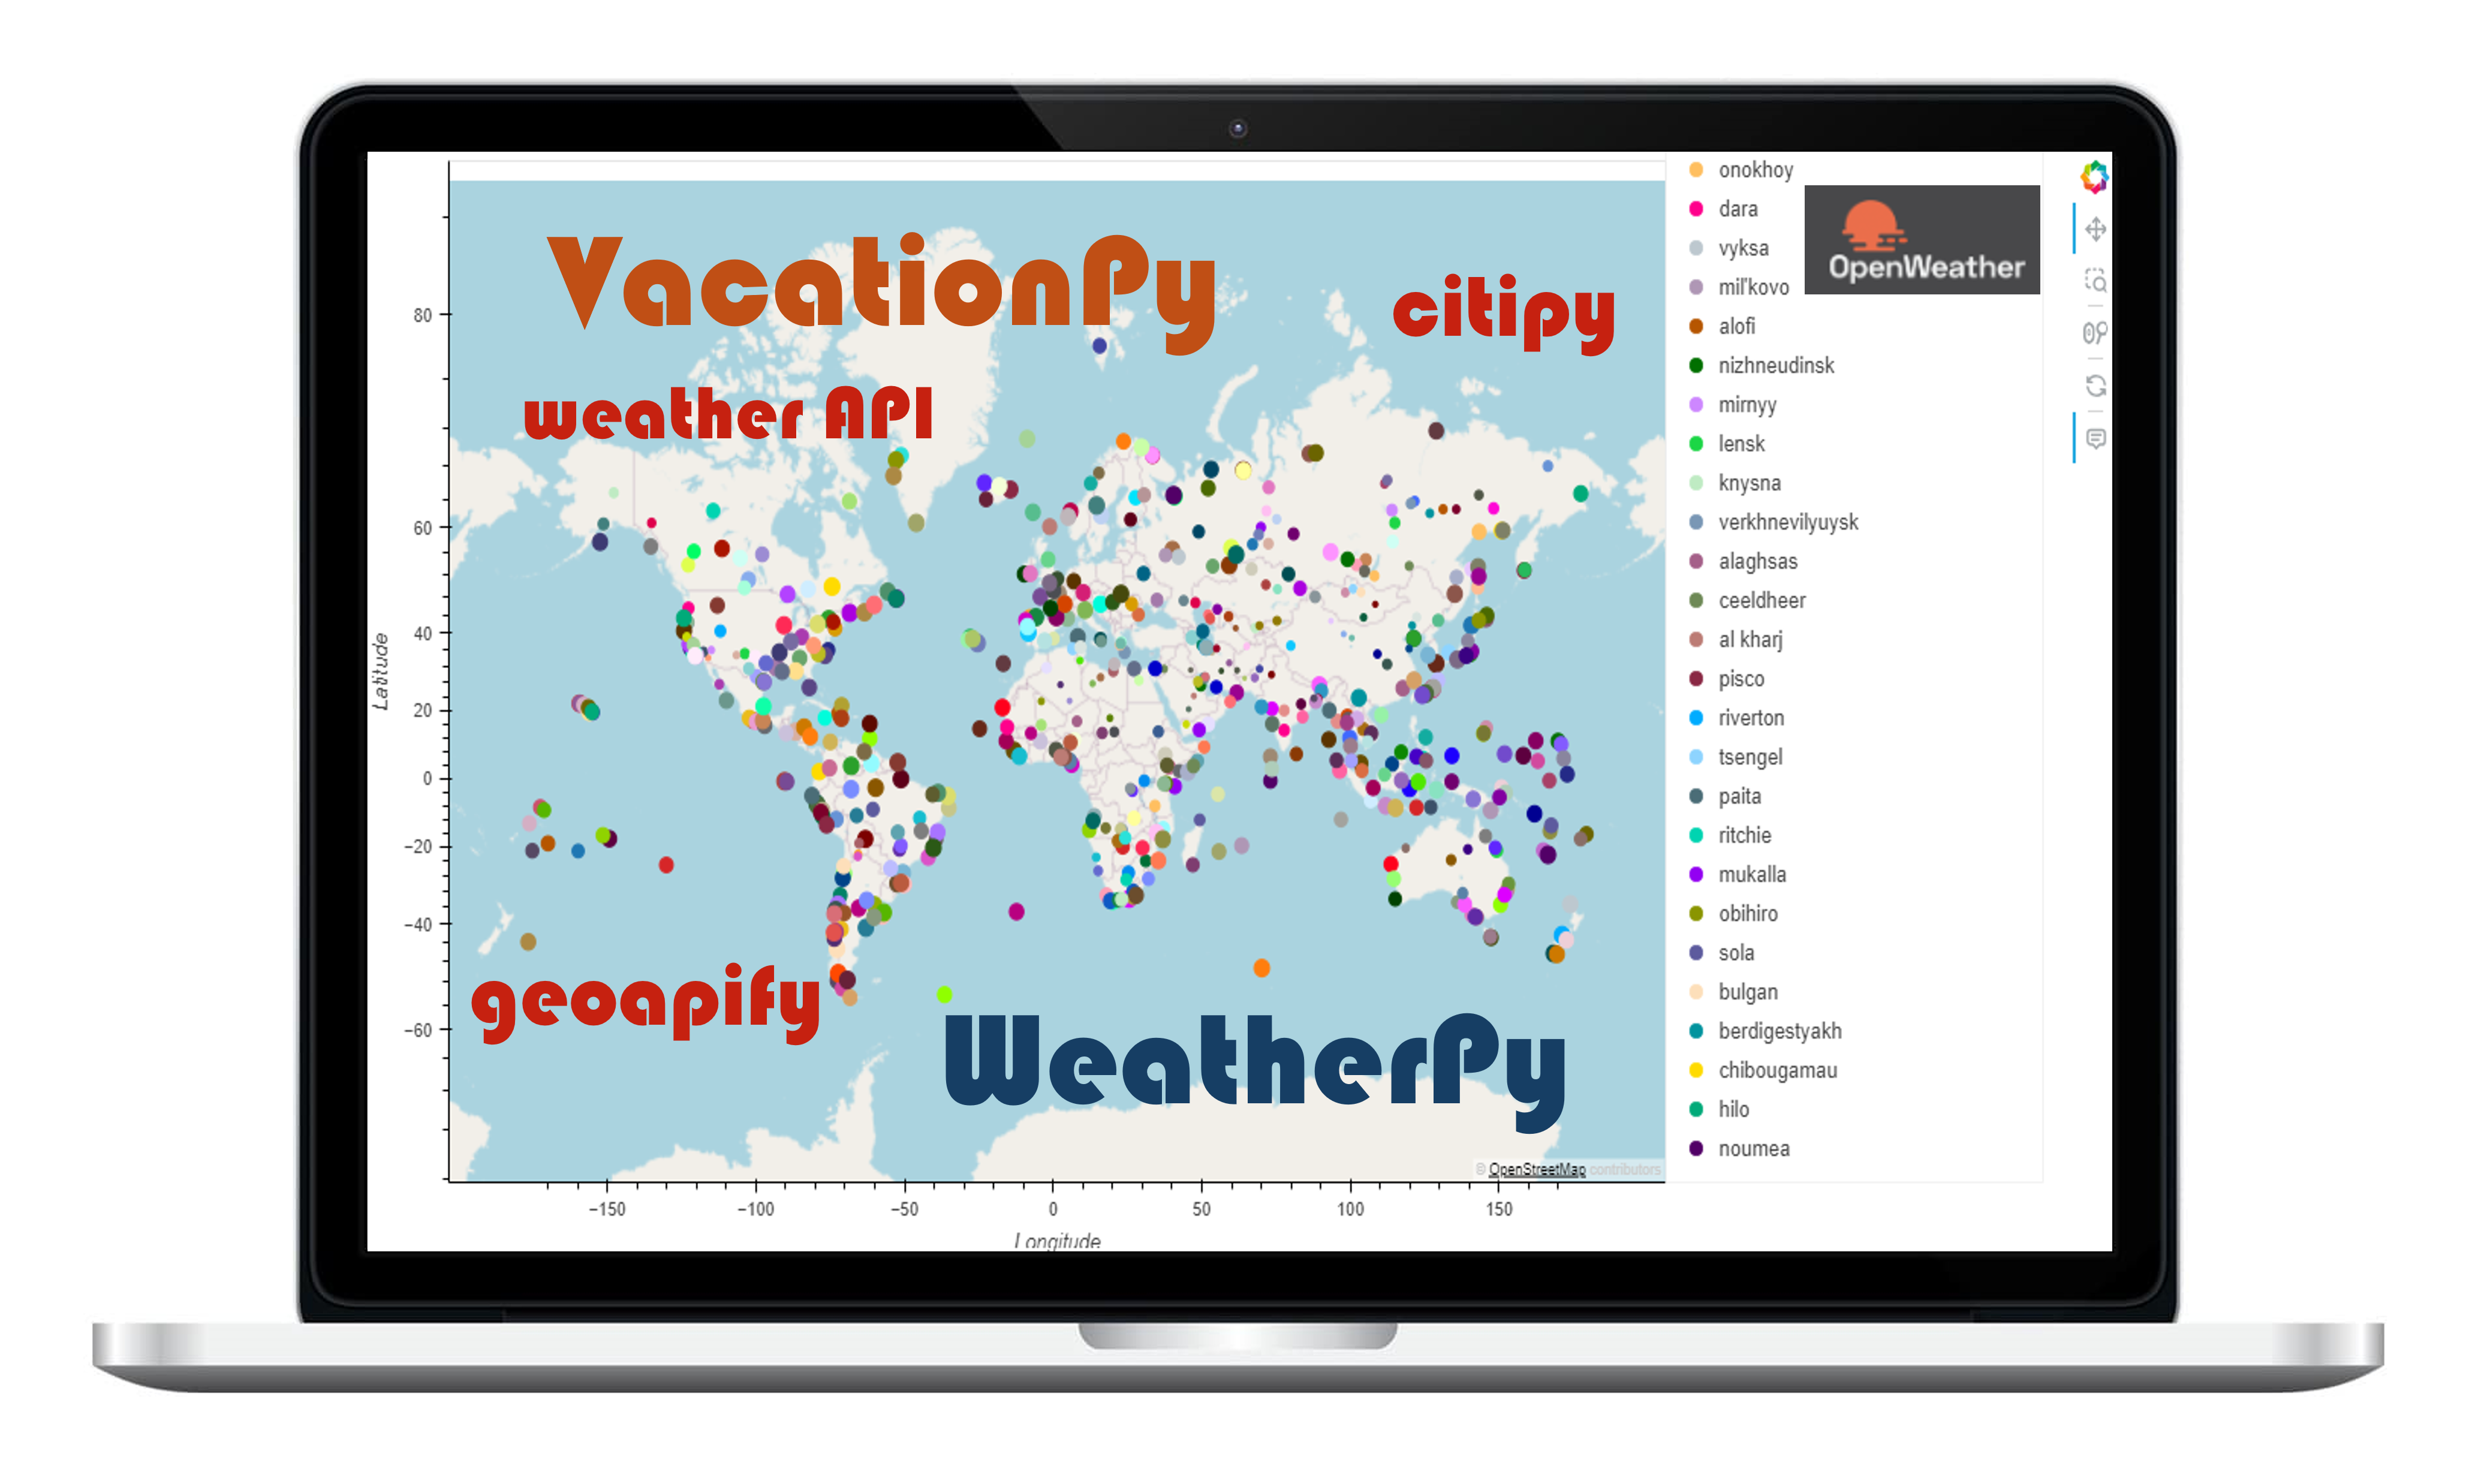
Project Overview
Data's true power is its ability to definitively answer questions. So, let's take what you've learned about Python requests, APIs, and JSON traversals to answer a fundamental question: "What is the weather like as we approach the equator?" Now, we know what you may be thinking: “That’s obvious. It gets hotter.” But, if pressed for more information, how would you prove that?
Instructions
This activity is broken down into two deliverables, WeatherPy and VacationPy.
Part 1: WeatherPy
In this deliverable, you'll create a Python script to visualize the weather of over 500 cities of varying distances from the equator. You'll use the citipy Python library, the OpenWeatherMap API, and your problem-solving skills to create a representative model of weather across cities. For this part, you'll use the WeatherPy.ipynb Jupyter notebook provided in the starter code ZIP file. The starter code will guide you through the process of using your Python coding skills to develop a solution to address the required functionalities. To get started, the code required to generate random geographic coordinates and the nearest city to each latitude and longitude combination is provided.
Part 2: VacationPy
In this deliverable, you'll use your weather data skills to plan future vacations. Also, you'll use Jupyter notebooks, the geoViews Python library, and the Geoapify API. The code needed to import the required libraries and load the CSV file with the weather and coordinates data for each city created in Part 1 is provided to help you get started. Your main tasks will be to use the Geoapify API and the geoViews Python library and employ your Python skills to create map visualizations.

