Logo Image
Thay Chansy

Thay Chansy

Principal Engineer | Certified NASA ESD Instructor | Trained NCMA Contracts Management Associate | Trained ASCM Supply Chain Management, Planning & Procurement Professional | Student of Data Science, Analytics & Machine Learning

About Me

The future is data-driven, and it's exciting to dive into it.

Get to know me!

My name is Thay Chansy (pronounced Tie Chan-See) and I'm a Student of Data Science, Analytics, Engineering and Machine Learning at UC Berkeley Extension, University of Texas at Austin, Massachusetts Institute of Technology, and Eastern University. I'm located in the Los Angeles Metro Area with over 20 years in the aerospace industry. I am a highly experienced Principal Engineer and Certified NASA ESD Instructor.

Feel free to contact me here.

Contact

My Skills

HTML
CSS
JavaScript
GIT
Python
MySQL
Flask
VS Code
Statistical Data Anaylsis
Jupyter Notebook
PyScript
Tableau
PowerBI
VBA
Pandas
Numpy
Seaborn
API

Projects Data Analytic Projects incorporating VBA Automation, MySQL, Python, Pandas and more for data exploration and visualization. As well using these tools to clean and analyze a large dataset.

Software Screenshot

Project 1

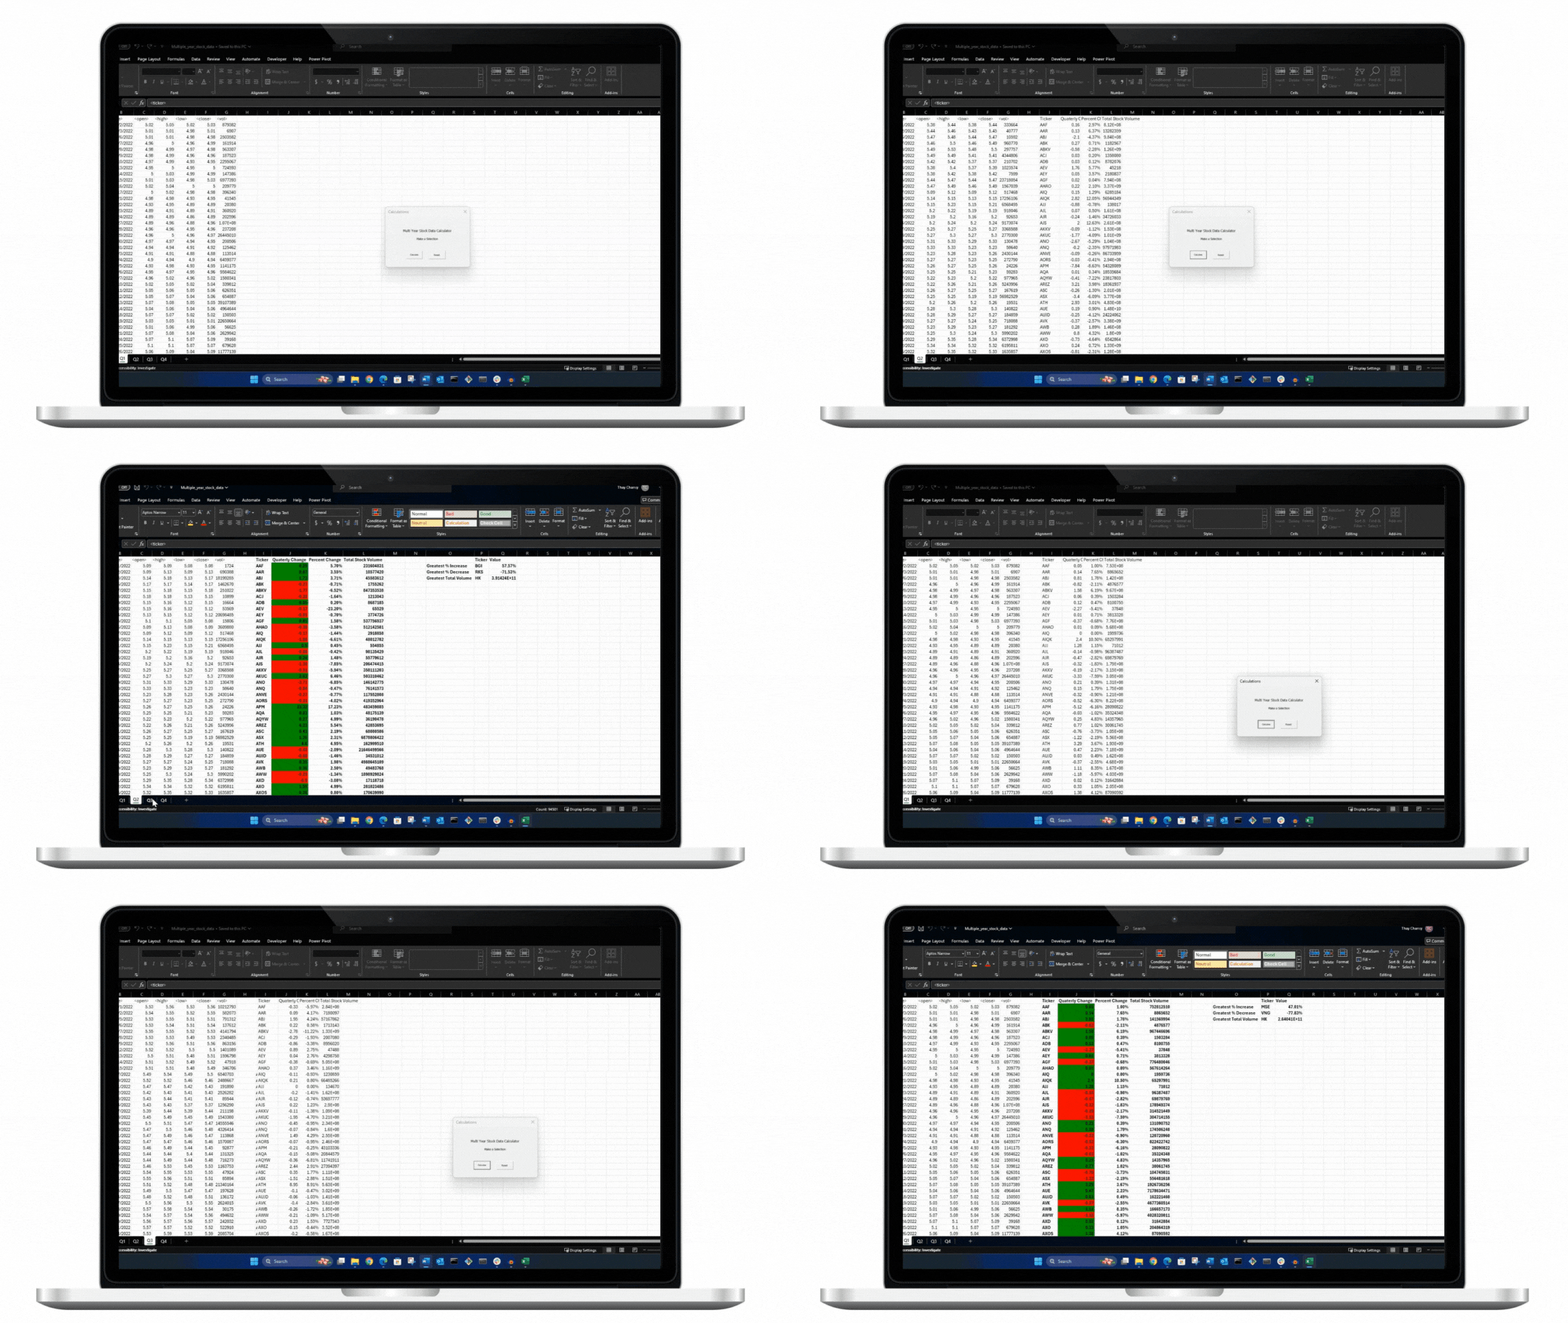
Create a VBA script that loops through all the stocks for each quarter and outputs the following information: 1) The ticker symbol 2) Quarterly change from the opening price at the beginning of a given quarter to the closing price at the end of that quarter 3) The percentage change from the opening price at the beginning of a given quarter to the closing price at the end of that quarter 4) The total stock volume of the stock.

Case Study
Software Screenshot

Project 2

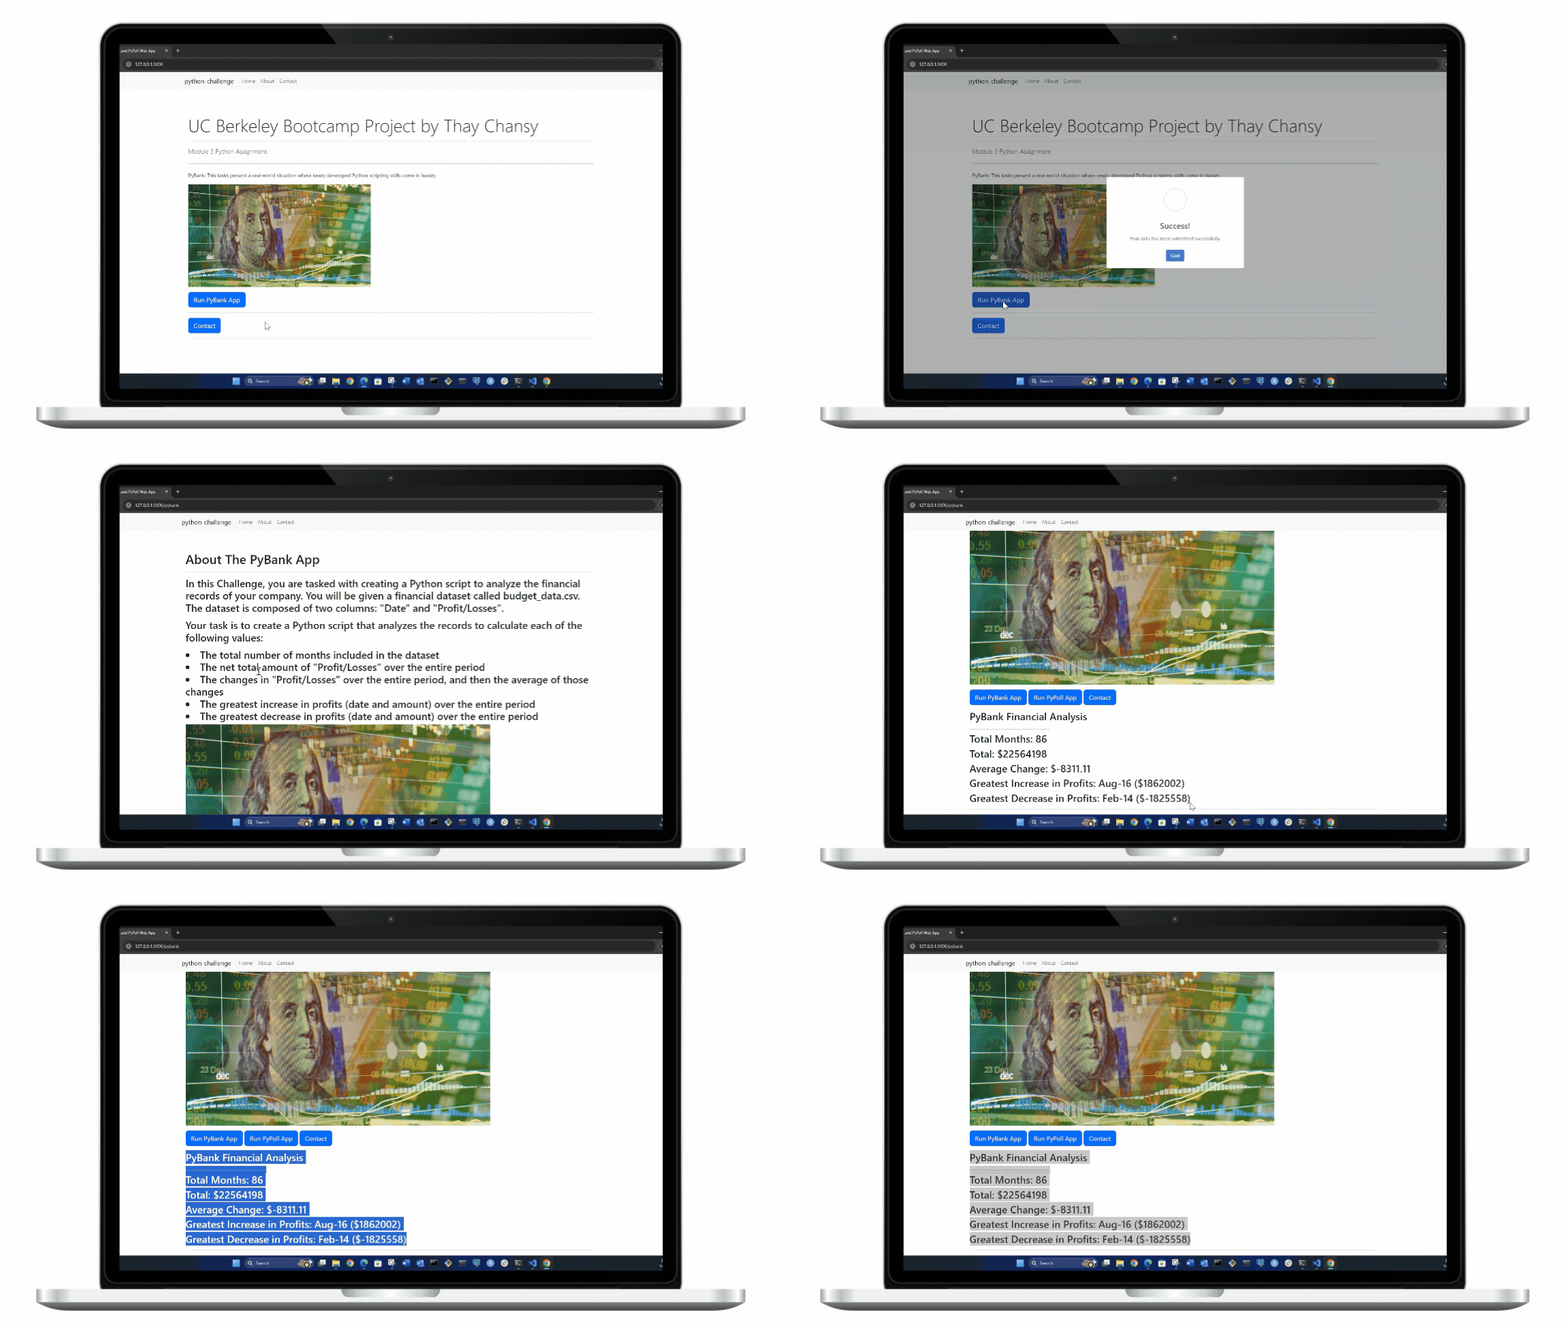
In this Challenge, you are tasked with creating a Python script to analyze the financial records of your company. You will be given a financial dataset called budget_data.csv. The dataset is composed of two columns: "Date" and "Profit/Losses".

Case Study
Software Screenshot

Project 3

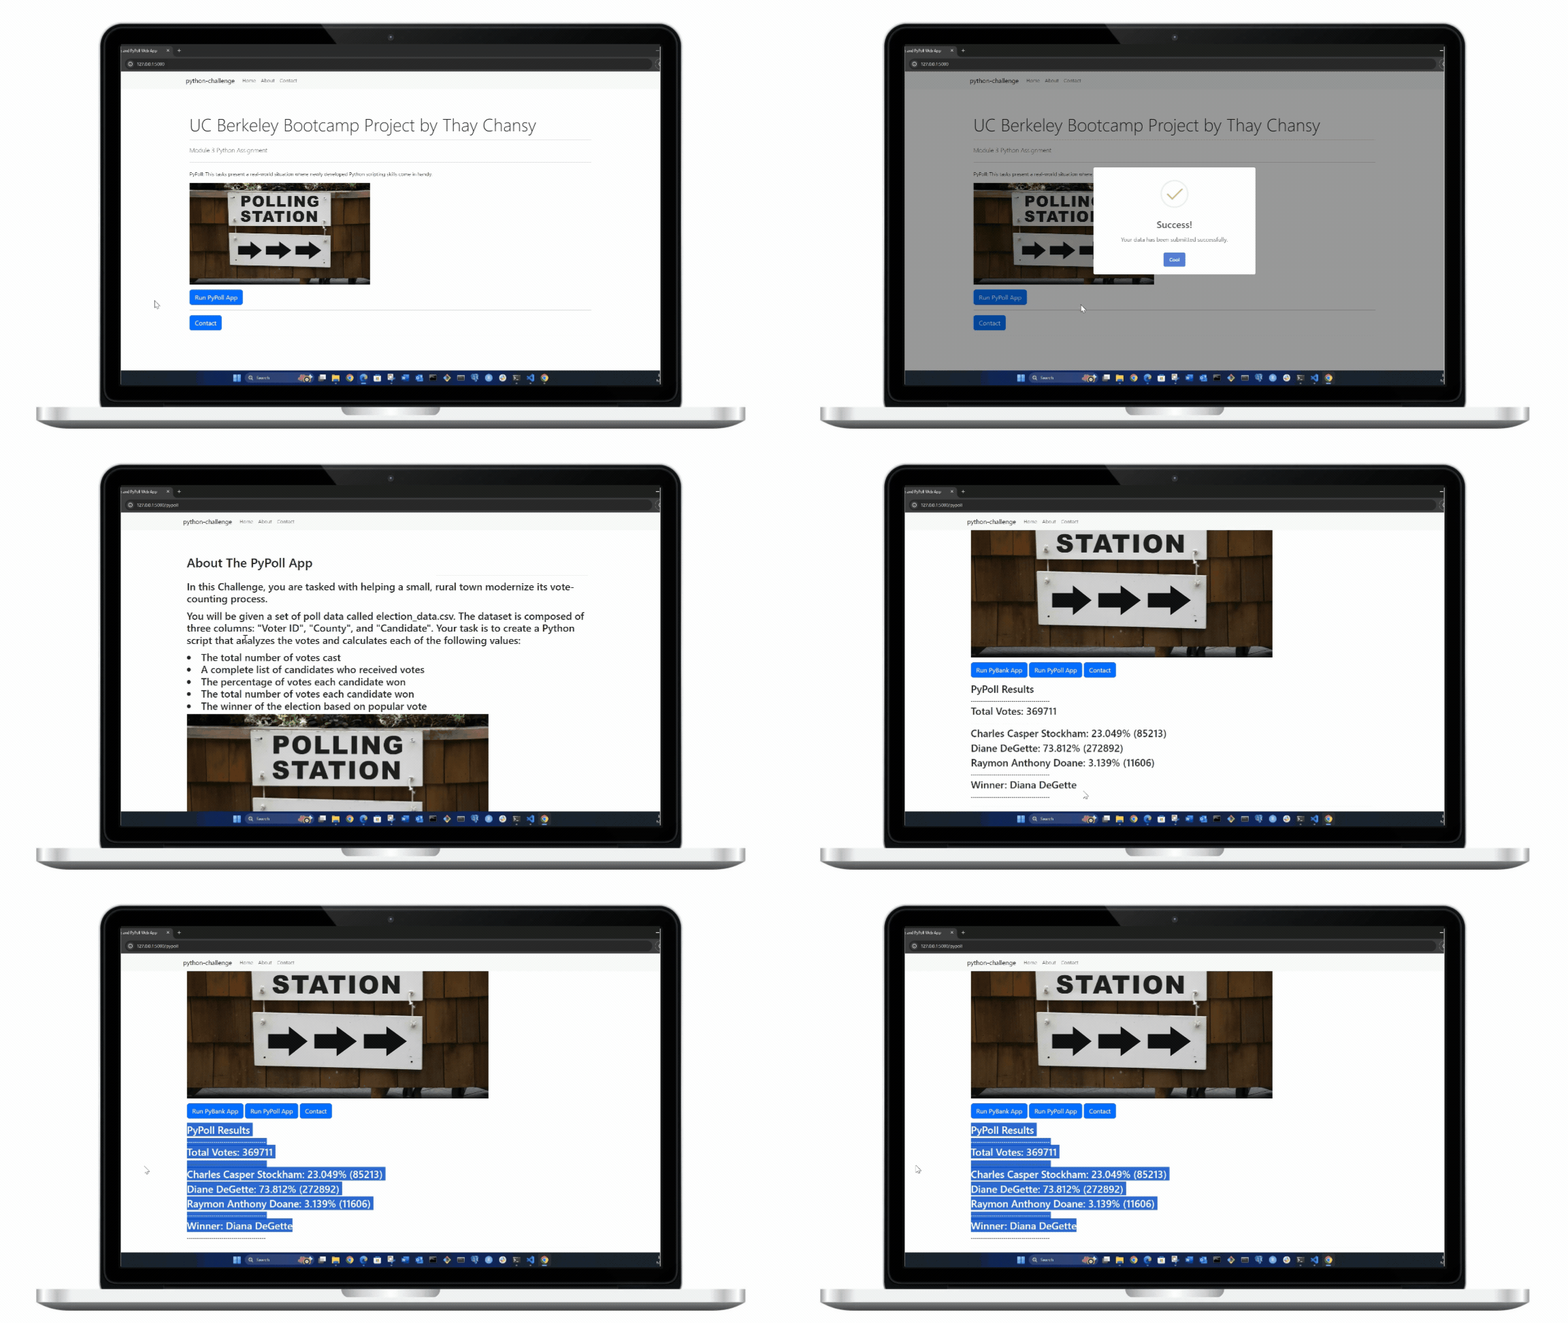
In this Python Challenge, you are tasked with helping a small, rural town modernize its vote-counting process. You will be given a set of poll data called election_data.csv. The dataset is composed of three columns: "Voter ID", "County", and "Candidate".

Case Study
Software Screenshot

Project 4

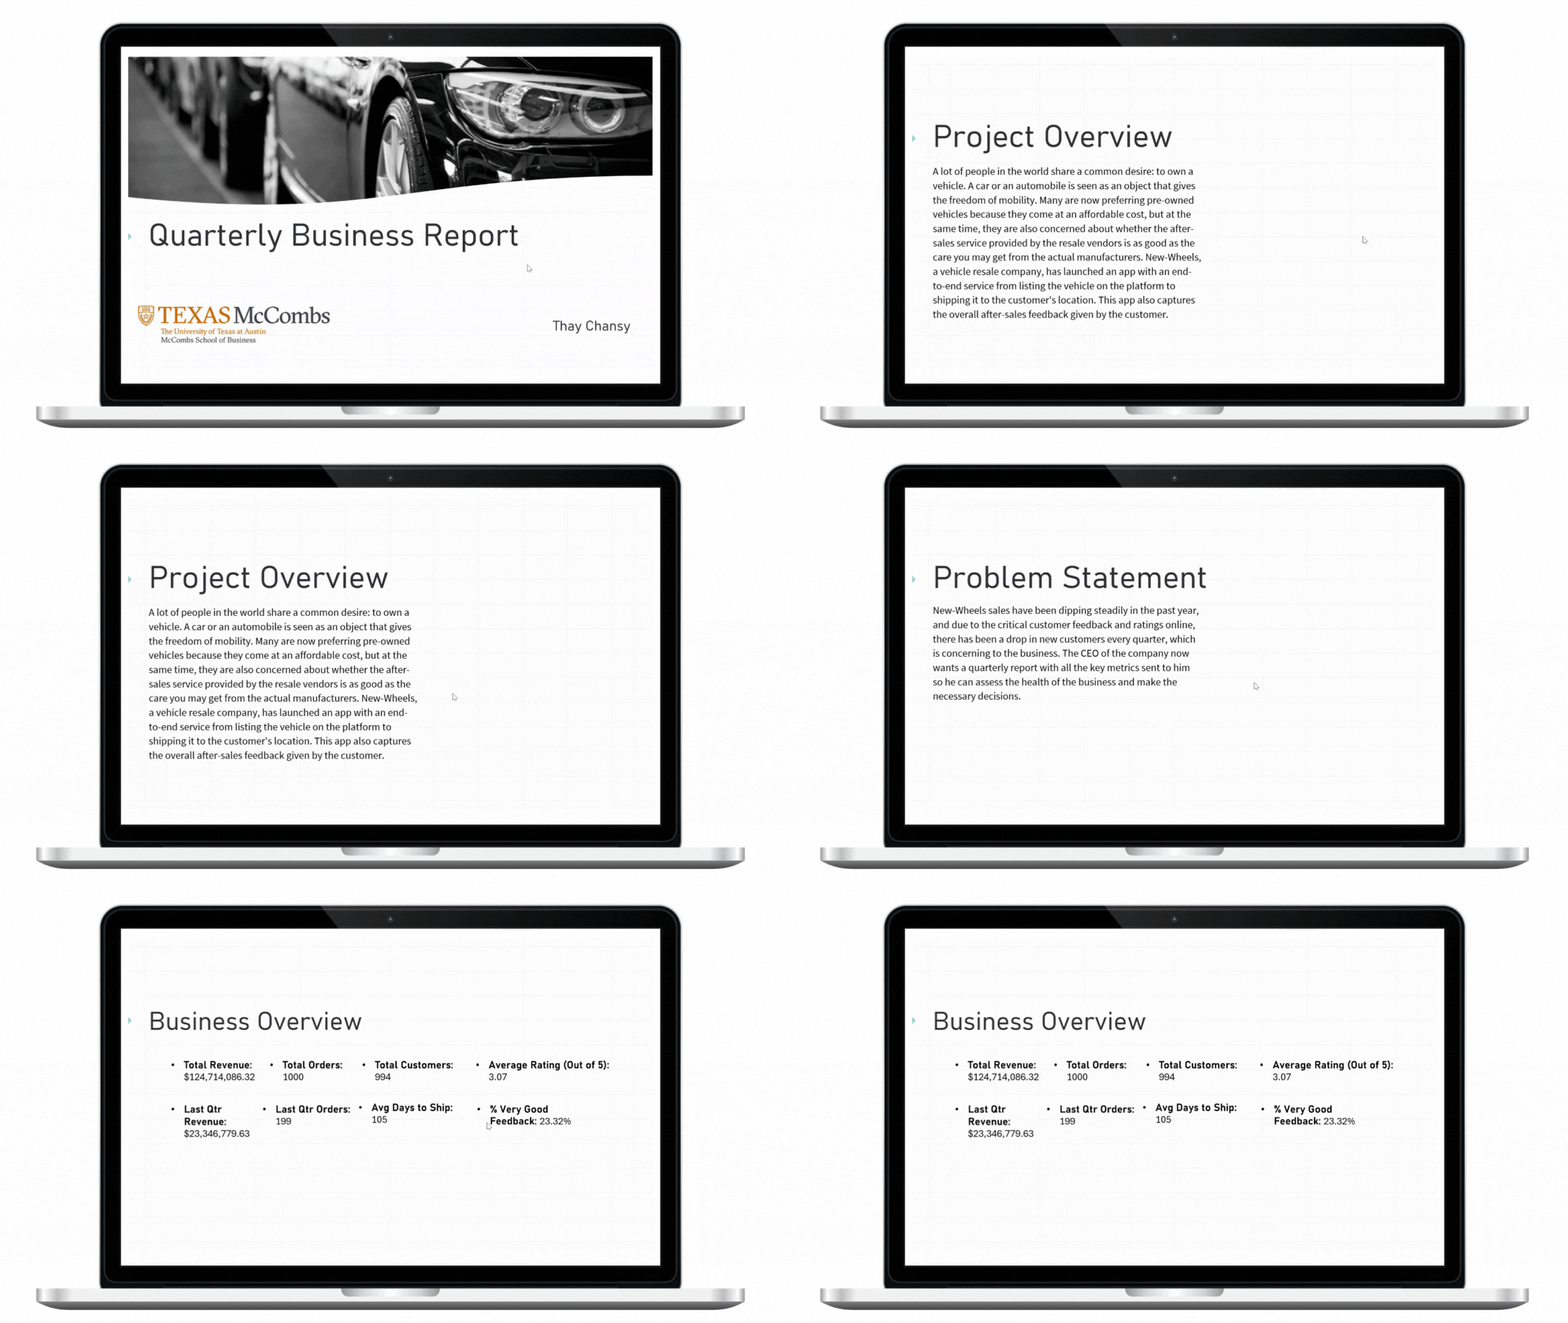
New-Wheels sales have been dipping steadily in the past year, and due to the critical customer feedback and ratings online, there has been a drop in new customers every quarter, which is concerning to the business. The CEO of the company now wants a quarterly report using MySQL with all the key metrics sent to him so he can assess the health of the business and make the necessary decisions.

Case Study
Software Screenshot

Project 5

You are the new Chief Data Scientist for your city's school district. In this capacity, you'll be helping the school board and mayor make strategic decisions regarding future school budgets and priorities. As a first task, you've been asked to analyze the district-wide standardized test results. You'll be given access to every student's math and reading scores, as well as various information on the schools they attend. Your task is to aggregate the data to showcase obvious trends in school performance using Pandas Dataframes.

Case Study
Software Screenshot

Project 6

As a Senior Data Analyst at the company, you've been given access to the complete data from their most recent animal study. In this study, 249 mice who were identified with SCC tumors received treatment with a range of drug regimens. Over the course of 45 days, tumor development was observed and measured. The purpose of this study was to compare the performance of Pymaceuticals’ drug of interest, Capomulin, against the other treatment regimens. The executive team has tasked you with generating all of the tables and figures needed for the technical report of the clinical study. They have also asked you for a top-level summary of the study results using Descriptive Statistics and Data Visualization.

Case Study
Software Screenshot

Project 7

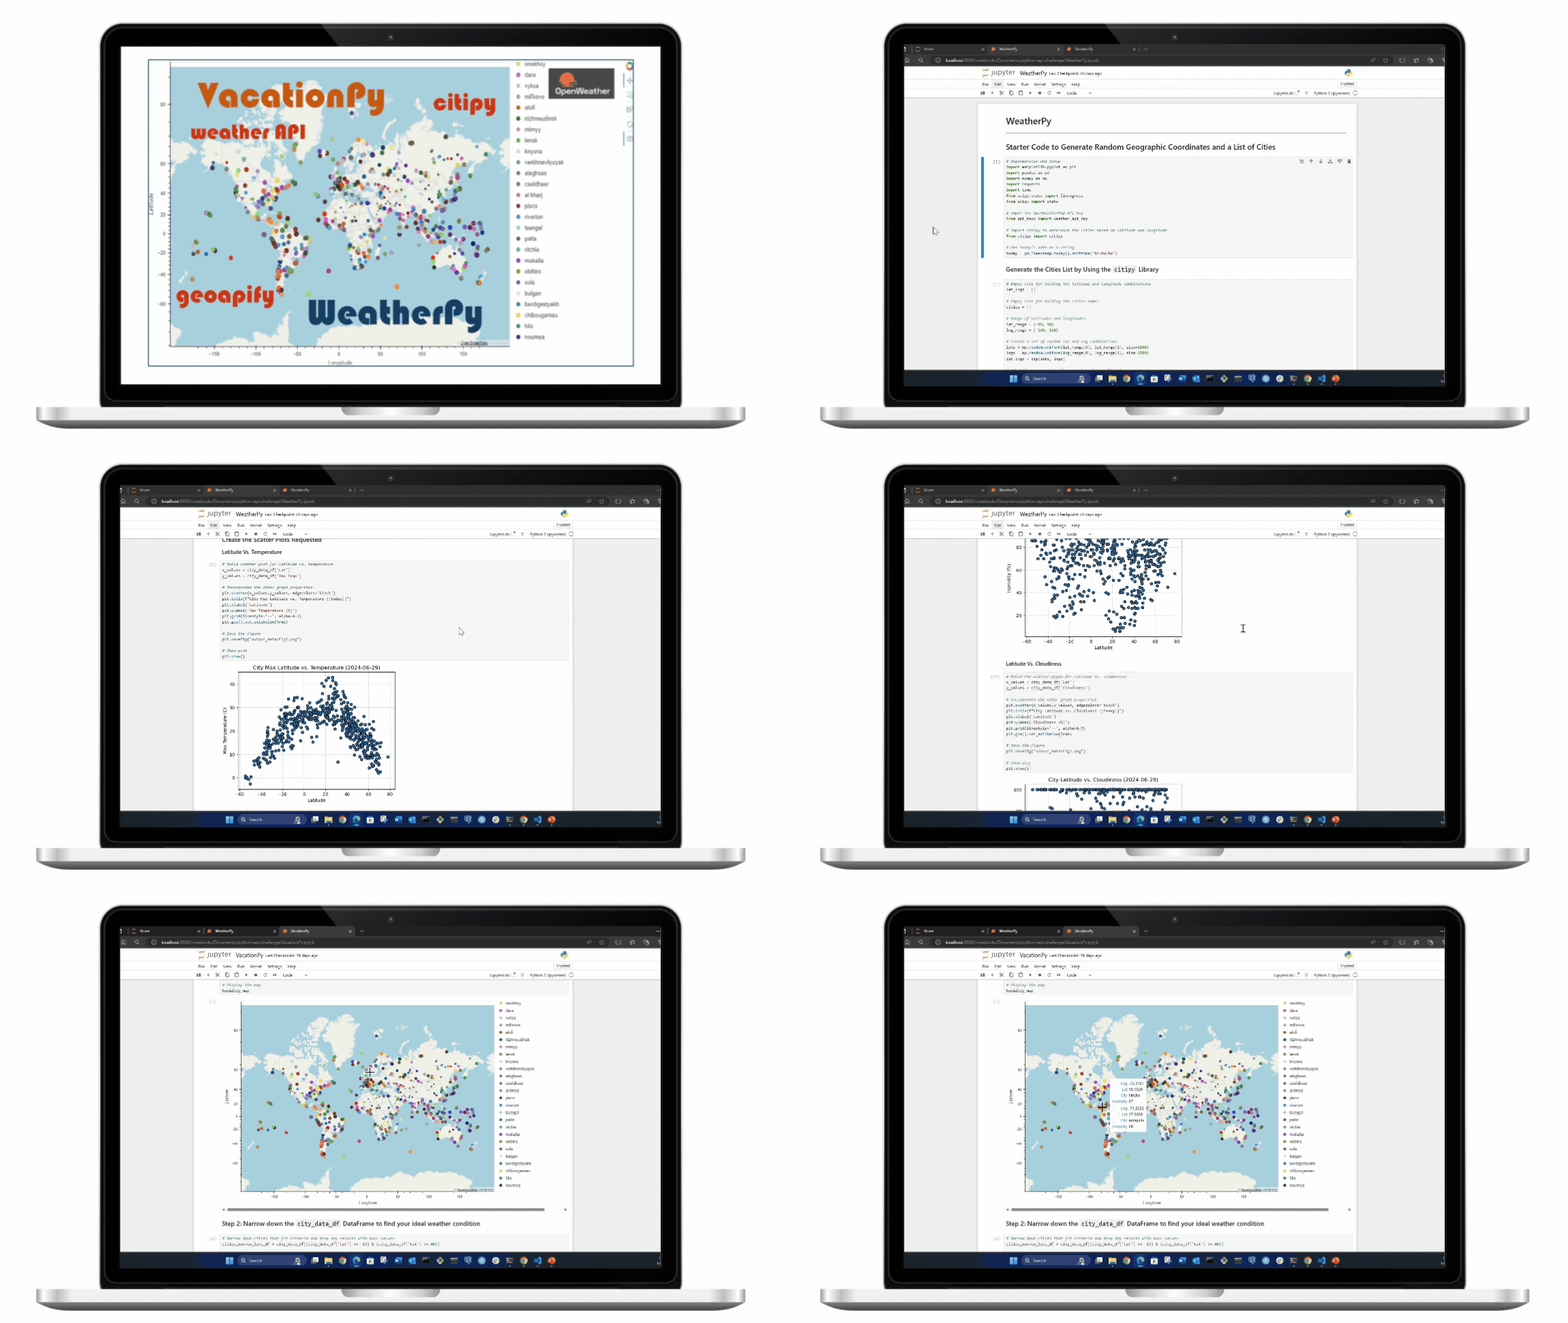
Part 1: WeatherPy. In this deliverable, you'll create a Python script to visualize the weather of over 500 cities of varying distances from the equator. You'll use the citipy Python library, the OpenWeatherMap API, and your problem-solving skills to create a representative model of weather across cities. Part 2: VacationPy. In this deliverable, you'll use your weather data skills to plan future vacations. Also, you'll use Jupyter Notebooks, the geoViews Python library, and the Geoapify API.

Case Study
Software Screenshot

Project 8

A food aggregator company named FoodHub has stored the data of the different orders made by the registered customers in their online portal. They want to analyze the data to get a fair idea about the demand of different restaurants which will help them in enhancing their customer experience. Suppose you are hired as a Data Scientist in this company and the Data Science team has shared some of the key questions that need to be answered. Perform the data analysis to find answers to these questions that will help the company to improve the business.

Case Study

Contact